Prompt Library for Gastronomy Consultant Pro: Diagnose & Profit
A library of 102 prompts for Gastronomy Consultant Pro, the business consulting agent in AI Chef Pro. Run financial diagnostics, P&L analysis, due diligence, business planning.

Gastronomy Consultant Pro is the AI agent that audits a restaurant's financial and operational guts to pinpoint exactly where money is leaking. It analyzes P&L statements, recipe costs with real-world waste, food, beverage and labor costs, prime cost, and break-even point, then delivers a diagnostic report with a prioritized action plan. It handles the heavy lifting of restaurant analytics—from line-item P&L deep-dives to plate-cost cards that factor in trim, over-portioning, and spoilage. The output isn't just a spreadsheet dump; it's a narrative that flags the three biggest margin killers and maps the next 90 days. Whether you're a chef-owner, a multi-unit operator, or a kitchen manager who needs to justify a capex ask, this agent translates line-level chaos into boardroom-ready numbers—without the consultant's day rate.
Why prompts matter with Gastronomy Consultant Pro
The difference between a generic “analyze my P&L” prompt and a precise one is the difference between a shrug and a surgical strike. Restaurant financial data is messy: COGS categories vary, payroll splits tipped vs. non-tipped, and “prime cost” is trade-specific. A vague prompt yields generic advice about “cutting costs”—which every operator already knows. A detailed prompt that specifies the restaurant’s segment, sales mix, and the cost lines you track forces Gastronomy Consultant Pro to compare your numbers against segment benchmarks, flag outliers, and suggest line-item actions that respect your concept and local labor market. If you don’t tell it you run a fast-casual pizza joint with 60% off-premise, it can’t know that 32% labor is a fire alarm.
More than that, the agent’s recommendations are only as good as the constraints you give it. When prompting for a business plan or an acquisition due-diligence, you must specify the lease structure, debt service, cap-ex backlog, and the realistic turnaround timeline. Otherwise, the output won’t factor in landlord CAM charges or the walk-in that needs replacing next quarter. The prompts in this library don’t just ask questions; they frame the scenario so the agent acts like a partner who has already walked your kitchen and read your invoices.

Prompt examples for Gastronomy Consultant Pro
The 102 prompts in this library are organized around the real workflow of a restaurant operator or advisor: financial diagnostics, menu engineering, labor optimization, business planning, and pre-acquisition due diligence. You’ll find everything from a quick “spot the leak” triage prompt to a multi-step investment memo template that pulls in lease terms, unit economics, and a 13-week cash flow forecast. Each prompt is written to be copied, lightly customized with your numbers, and run immediately—no data science degree required. Every prompt assumes a US kitchen context but flags the few places where UK, ANZ, or India operators should swap in their own regulatory references.
Prompts for Integrated Culinary Diagnostic Consultant in Gastronomy Consultant Pro
Gastronomy Consultant Pro is the specialist who audits the financial and operational guts of a restaurant to pinpoint exactly where money is leaking. It analyzes your P&L, plates costing with real waste, food/beverage/labor cost, prime cost, and break‑even point, then delivers a diagnostic report with a prioritized action plan. Whether you run a single location or a multi‑unit group, it digs into your numbers to expose hidden waste, theft, over‑portioning, and margin‑killers, giving you a clear, actionable roadmap back to profitability.
How to use these prompts
Start with a short prompt like “Audit my restaurant’s finances” and turn it into a hyper‑specific brief. For example: “Audit the P&L of my Mediterranean restaurant in Los Angeles (monthly revenue $95,000, average check $42, 120 seats, open 6 days/week). Calculate real vs theoretical food cost, beverage cost, labor cost, prime cost, and break‑even point. Identify the top 5 money leaks and classify corrective actions into quick wins (30 days) and structural improvements (60‑90 days).” The more specific you are, the better the result.
| Prompt / Request | Area / Goal / Pain point | Category |
|---|---|---|
| «Calculate real vs theoretical food cost for my Italian restaurant in New York: we sell 850 pizzas per week (avg price $16.50) and 320 pastas ($14.50). We use burrata mozzarella (cost $9.50/lb, waste 8%), cherry tomatoes ($2.20/lb, waste 25%), 00 flour ($0.90/lb, waste 3%). Determine theoretical cost per plate, estimated real food cost, and percentage variance.» | plate costing with waste & food cost | financial analysis |
| «Perform a full plate costing for my premium burger (menu price $26.90): brioche bun (3 oz, $1.10/lb, waste 12%), Wagyu beef patty 8.8 oz ($14.50/lb, waste 5%), smoked cheddar 2.1 oz ($6.60/lb, waste 5%), Iberian bacon 1.4 oz ($11.80/lb, waste 10%), secret sauce 1.8 oz ($3.85/lb, waste 15%), side fries 7 oz ($0.55/lb, waste 20%). Calculate raw ingredient cost per plate, gross margin, and food cost %.» | detailed plate costing with waste | financial analysis |
| «Calculate the prime cost of my fine‑dining restaurant in Chicago: monthly revenue $105,000, food cost $35,000, beverage cost $11,000, labor cost (wages + payroll taxes) $29,000. Determine if it’s within the optimal range (<65%), compare with industry benchmarks, and propose adjustments if it exceeds the threshold.» | prime cost calculation | financial analysis |
| «Generate a complete financial diagnostic report in PDF for my restaurant group with 3 locations (total monthly revenue $420,000). Include: vertical and horizontal P&L analysis, food/beverage/labor cost breakdown by business unit, consolidated break‑even calculation, identification of the top 10 money leaks, and a prioritized action plan with responsible parties and timelines.» | diagnostic report PDF | consulting deliverable |
| «Find updated 2024‑2025 benchmarks for chef‑driven restaurants in the US: average food cost%, beverage cost%, labor cost%, prime cost%, average net margin by location type (New York vs Los Angeles vs secondary cities). Compare my restaurant (food cost 34%, labor 32%, net margin 8%) to the market and highlight improvement opportunities.» | sector benchmark 2024‑2025 | market data |
| «Build a CSV operational KPI dashboard for my tapas restaurant in Austin, TX (monthly revenue $75,000, average check $27, 95 seats). Include: food cost%, beverage cost%, labor cost%, prime cost%, covers/month, actual average check, table turnover, weekly waste, estimated theft/loss rate, and gross margin by menu section. Add target and variance columns.» | KPI dashboard CSV | consulting deliverable |
| «Distinguish quick wins (implementable in 30 days) from structural improvements (60‑90 days) for my restaurant with monthly revenue $80,000, food cost 38% (target 31%), labor 29% (target 32%), and net margin 5% (target 15%). For each action, include: description, required investment, estimated margin impact, and implementation difficulty.» | quick wins vs structural improvements | action plan |
| «Calculate the break‑even point for my restaurant in Los Angeles: initial investment $320,000, monthly overheads (rent $9,500, utilities $1,400, insurance $500, maintenance $900, licenses $350), average food cost 32%, beverage cost 22%, labor cost 34%. Average monthly revenue is $105,000 with an average check of $48. Determine how many daily covers I need and how long to recoup the investment (payback).» | break‑even and payback | financial analysis |
| «Conduct an economic leakage audit for my seafood restaurant in Boston (monthly revenue $85,000): analyze whole fish waste (40% average waste), detectable vs undetectable; possible beverage theft (industry benchmark 2‑4% of beverage cost); order errors (standard 1.5% of sales); overproduction and waste; obsolete inventory. Quantify each leak in dollars/month and propose specific controls.» | economic leakage audit | operational diagnosis |
| «Compare real vs theoretical food cost for my appetizer menu (5 items): cod croquettes (ingredient cost $2.10, menu price $9.50), shrimp tortilla ($1.85, $8.90), fried calamari ($2.40, $10.20), house patatas bravas ($1.20, $7.50), mushroom ajillo ($1.65, $8.80). Calculate theoretical average food cost for the section, real food cost based on last month’s actual sales (285/195/310/420/180 units), and the deviation. Recommend price adjustments or reformulation.» | real vs theoretical food cost by section | financial analysis |
| «Provide a monthly P&L template for a restaurant with two dining areas (indoor 80 seats, patio 40 seats) in a tourist area of Miami. Must include: revenue by section, cost of sales broken down (food/beverage), gross margin, detailed labor expenses, other operating expenses, EBITDA, depreciation, pre‑tax income. Add comparison cells vs previous month and vs budget with visual alerts for deviations >5%.» | monthly P&L template | management tool |
| «Draft a consulting business proposal for an investor buying a restaurant takeover at $200,000 in Chicago’s business district. The proposal must include: due diligence scope (contract analysis, inventory valuation, P&L audit of the last 3 years, revenue potential estimate, real profitability calculation), delivery timeline (10 business days), deliverables (due diligence report in PDF, executive memo), fees (percentage of takeover or fixed), and payment terms.» | due diligence proposal | consulting deliverable |
| «Project 3 revenue and profitability scenarios for my expanding Italian restaurant: conservative scenario (stable at $95,000/month), base scenario (8% growth from new artisan pizza menu), optimistic scenario (15% growth from patio opening). For each scenario: project food cost, labor cost, prime cost, EBITDA, and net margin over 12 months, factoring in industry seasonality.» | 3‑scenario projection | business plan |
| «Analyze the cost structure of my premium cocktail bar in New York: monthly revenue $36,000 (average check $16.50, 2,200 cocktails), current beverage cost 28% (target 20‑22%), ice consumption 400 lb/month ($0.45/lb), garnish decoration ($14/day), broken glassware ($200/month). Identify opportunities to optimize beverage cost, calculate potential savings, and recommend a cocktail menu with higher margins (at least 5 recipes with beverage cost <18%).» | bar beverage cost optimization | area analysis |
| «Design a waste control system for my central kitchen serving 1,200 covers/day across 2 restaurants. Must include: receiving protocol (temperature, weight, quality control with photos), FIFO storage with expiration dates, yield table by product (fish 55%, meat 70%, vegetables 80%), shift waste log with photo and cause, automatic weekly waste report by section and associated cost. Format: PDF procedure document.» | waste control system | operating procedure |
Prompts for Business Plan, Viability & Due Diligence Specialist in Gastronomy Consultant Pro
The Business Plan, Viability & Due Diligence Specialist builds robust financial models, analyzes restaurant project viability, and conducts thorough audits for investors. Gastronomy Consultant Pro helps you generate 3-year projections with EBITDA, payback period, and IRR; perform buy-sell due diligence; calculate break-even points; value assets; and produce professional deliverables ready for banks or investors. Whether you're launching a new concept in Chicago, acquiring an existing spot in Austin, or optimizing a multi-unit group's P&L, this agent delivers the numbers and narrative that lenders and stakeholders expect.
How to use these prompts
These are starting points you can adapt to your kitchen and your collection. For instance, if you start with the prompt "Build me a business plan for my restaurant," you could customize it like this: "Build a 3-year business plan for a 150-seat restaurant in a corporate district of Chicago serving contemporary American cuisine. Target first-year revenue: $2,100,000 (average lunch check $38, dinner check $58, average occupancy 80% over 2 turns, 300 days). Estimated initial investment: $750,000 (build-out, equipment, working capital). I need year-over-year EBITDA projection with monthly break-even, payback period, and expected IRR, plus pessimistic/base/optimistic scenarios with assumptions. Format: executive summary for a bank presentation." The more specific you are, the better the result.
| Prompt / Request | Area / Goal / Pain point | Category |
|---|---|---|
| «Build a 3-year business plan for a 150-seat restaurant in a corporate district of New York serving contemporary American cuisine. Target first-year revenue: $2,100,000 (average lunch check $38, dinner check $58, average occupancy 80% over 2 turns, 300 days). Estimated initial investment: $750,000 (build-out, equipment, working capital). I need year-over-year EBITDA projection with monthly break-even, payback period, and expected IRR, plus pessimistic/base/optimistic scenarios with assumptions. Format: executive summary for a bank presentation.» | Business plan with financial projections | Strategic planning |
| «I need a full due diligence report for the acquisition of a high-end restaurant in San Francisco with declared revenue of $1,800,000, average check $95, and 70 covers. I need to validate financial information, identify hidden liabilities, calculate the offer range for negotiation using EBITDA multiples (sector 3-4x), audit the last 2 years' P&L, verify current contracts (lease, employees, suppliers), and evaluate online reputation. Include a conclusions document with investment recommendation and critical alerts for the buyer.» | Buy-sell due diligence | Investment analysis |
| «Calculate the full plate cost for roasted halibut with seasonal vegetable garnish for a fine dining restaurant. Data: wholesale market purchase price $18.50/lb (tax excluded), technical trim loss 42% (cleaning and portioning), actual fish yield 58%. Garnish cost: $3.20 per plate. Preparation cost (cooking, finishing, plating): $1.80. Customer selling price: $38 including tax. I need the real food cost in dollars and percentage, the gross margin for this dish, and whether it is correctly priced according to the sector benchmark (food cost target 30-35%).» | Plate costing with trim loss percentage | Cost control |
| «Audit my full-service restaurant in a suburb of Austin, TX: annual revenue $850,000, 65 seats, 180 turns per year, average lunch check $28, dinner check $38. Population: 52,000. I need to calculate: actual food cost (I know I spend $238,000 on raw materials), beverage cost, labor cost, prime cost, and monthly break-even. Compare each ratio to sector benchmarks in this geographic area and flag any deviations exceeding 5% from target, identifying the likely root cause of each leak.» | P&L and ratio audit | Financial control |
| «Search Google for the most recent 2024 data on the US restaurant industry: average investment per seat for new openings by format (fine dining, casual dining, fast-casual), average check by category and region, evolution of food cost as a percentage of revenue, key consumption trends, first-year restaurant failure rate, and average labor costs including payroll taxes. I need this data to support the assumptions for my business plan for a 120-seat restaurant in a prime area of Chicago.» | Sector market benchmark | Market analysis |
| «Build a 3-year viability plan with scenarios for a 150-seat restaurant in a corporate district serving contemporary American cuisine. Base assumptions: average occupancy 80%, 2 turns daily, 300 days per year, weighted average check $33. Year 1 revenue: $2,376,000, year 2 growth: 8%, year 3: 6%. Initial investment: $750,000 with 60% bank financing. Calculate EBITDA, operating cash flow, estimated payback, IRR, and monthly break-even. Pessimistic scenario: occupancy 65% and check -10%. Optimistic scenario: occupancy 90% and check +5%. Include a comparative summary table and conclude on project viability for an investor with a 5-year horizon.» | Viability plan with scenarios | Financial projection |
| «Prepare a comprehensive diagnostic report in PDF for an investor considering the purchase of a mid-to-upscale restaurant with revenue of $900,000 and average check $42 in downtown Denver. The report must include: a 1-page executive summary, audit of the last 2 years' P&L, analysis of financial leaks (waste, inventory errors, theoretical vs actual food cost deviation), menu engineering matrix (stars/plowhorses/puzzles/dogs), ratio comparison (food cost, labor cost, prime cost, net margin) vs sector benchmarks, qualitative assessment of the team and current operations, and an improvement roadmap with quick wins (30 days) and a structural plan (60-90 days).» | Comprehensive diagnostic report | Full audit |
| «Build a complete valuation model for a restaurant in a prime area of Miami with the following data: revenue $1,350,000, EBITDA 14% ($189,000), net margin 8% ($108,000), outstanding bank debt $280,000 at 3.5% with 5 years remaining, estimated goodwill $180,000. Apply DCF methodology with 5-year cash flows and a 10% discount rate, and comparable sector EBITDA multiples (range 3-4x). Include a valuation range, sensitivity to 5% occupancy changes, and conclusions on fair market price for negotiation with the seller.» | Valuation model with DCF | Asset valuation |
| «Design a detailed opening roadmap for a 120-seat chef-driven restaurant in Los Angeles. Total investment: $700,000 (build-out 45%, equipment 35%, key money/lease rights 10%, working capital 10%). Total timeline: 120 days from lease signing to opening. I need a phased timeline: pre-opening 0-30 days (permits, contracts, initial hiring), build-out phase 30-75 days (coordination with architect, designer, permits), setup phase 75-100 days (equipment installation, initial inventory, supplier contracts), soft opening 100-110 days, and grand opening day 120. For each phase, indicate critical tasks, dependencies, suggested responsible, and estimated cost. Format: visual timeline table.» | 360° opening roadmap | Project management |
| «My current restaurant has a prime cost of 68% against a 65% target. Revenue $720,000, 60 seats, average check $30. I need a dual action plan: quick win actions in 30 days to reduce prime cost to 66% with no investment (renegotiation of 3 key suppliers, optimization of recipe specs with an 8% gram weight reduction, elimination of 2 low-margin menu items, implementation of daily inventory controls), and a structural plan in 60-90 days to reach 64% with an investment of up to $8,000 (inventory management software, team training on cost control, new digital plate-costing system, ABC supplier analysis). Quantify the annual economic impact of each measure.» | Quick wins vs structural improvements | Operational improvement plan |
| «Prepare a professional commercial proposal for a client who needs: full due diligence of a restaurant for sale (revenue $1,100,000), a 3-year viability plan for a new 100-seat project, and opening process supervision for 4 months. Detailed scope: financial and legal audit, valuation model, business plan with projections, supplier coordination and licensing, hiring of the management team. Methodology: 4 phases over 8-10 weeks. Timeline: due diligence weeks 1-2, viability plan weeks 3-5, opening supervision weeks 6-18. Propose a fixed fee per phase: due diligence $6,500, viability plan $4,500, opening supervision $9,000, plus travel expenses. Include post-opening monthly retainer options and payment terms.» | Commercial proposal with fees | Commercial and business |
| «Design a monthly KPI dashboard for a 3-restaurant group with consolidated revenue of $2,100,000 and 45 employees. The dashboard must include financial metrics (daily sales per unit, average check, food cost %, labor cost %, prime cost %, EBITDA %), operational metrics (covers per service, table turnover, daily waste in dollars, inventory turnover ratio), customer metrics (average Google and Yelp rating, estimated NPS, return/complaint ratio), and team metrics (monthly turnover, overtime %, absenteeism %). Each KPI with target, current value, and alert traffic light. Format exportable to CSV for Excel import with suggested charts for investor presentation.» | Operational KPI dashboard | Reporting and control |
| «Calculate the monthly break-even point for a restaurant with the following data: annual revenue $720,000, real food cost 31%, beverage cost 22%, labor cost 33%, other variable costs 4%. Monthly fixed costs broken down: rent $4,200, insurance and maintenance $850, utilities (electric, gas, water) $1,100, bank loan amortization $1,450, owner's self-employment tax $400, marketing and platform commissions $600. I need to know: monthly break-even in dollars, number of covers needed per month (average check $30), and what would happen to the break-even if food cost rises to 35% while keeping other variables constant. Include the calculation of the unit contribution margin.» | Break-even calculation | Profitability analysis |
Prompts for 360° Restaurant Opening Director in Gastronomy Consultant Pro
As a 360° Restaurant Opening Director, you need an agent that coordinates every phase of the project—from the initial site audit and due diligence to the grand opening. Gastronomy Consultant Pro helps you structure realistic timelines, detailed budgets, menu concepts, and contingency plans using real financial data, local market benchmarks, and industry-tested frameworks. It’s built for operators who need answers grounded in current US hospitality economics, not generic templates.
How to use these prompts
These are starting points that you can adapt to your operation and your concept. For example, if you start with a prompt like "Give me general information about opening a restaurant," you could personalize it like this: "I need a full opening roadmap for a 1,500 sq ft urban gastrobar concept in downtown Austin, TX, with a liquor license, planned opening in 5 months, and an investment budget of $450,000. Include a timeline with key dates, third-party coordination, a detailed budget by line item, and a contingency plan for licensing delays." The more specific you are, the better the result.
| Prompt / Request | Area / Goal / Pain point | Category |
|---|---|---|
| «Calculate the plate costing with yield percentage for the signature dish: whole wild striped bass, 2.6 lb at $8.50/lb, 55% yield after cleaning and deboning. Proposed menu price $36.50. What is the actual food cost and contribution margin?» | Plate Costing with Yield & Profitability | Financial Analysis |
| «Run a full projected P&L for year one of an 80-seat restaurant in Nashville, TN, with an average check of $42, 65% average occupancy, and break down: food cost 32%, beverage 22%, labor 31%, occupancy 12%, other operating expenses 8%. Calculate projected EBITDA and net margin.» | Projected P&L & Profitability | Financial Analysis |
| «Give me current US restaurant industry benchmarks for 2024-2025: average check by category (gastrobar, fine dining, casual dining), average labor costs, average food cost by segment, average rent per sq ft in major cities, and reference net margins.» | US Industry Benchmark 2024-2025 | Market Data |
| «Export to PDF a pre-opening diagnostic report that includes: location and competition analysis for the downtown Chicago area, realistic average check estimate, year 1 sales projection, investment breakdown by category, and opening timeline with critical milestones.» | Pre-opening Diagnostic Report PDF | Consulting Deliverable |
| «Calculate the three key ratios and prime cost for a Mediterranean restaurant with projected monthly sales of $92,000: food cost $32,500, beverage $13,800, labor $27,500. Tell me if they meet industry standards and suggest adjustments if prime cost exceeds 65%.» | Ratio & Prime Cost Calculation | Financial Analysis |
| «Distinguish quick wins from structural improvements for a restaurant opening in 60 days: give me 5 immediate actions (30 days) to maximize revenue and cut costs with no investment, and 3 structural improvements (60-90 days) that require investment and deeper reorganization.» | Quick Wins vs Structural Improvements | Action Plan |
| «Generate a consulting proposal for an investor who wants to open a food hall concept with 6 stalls in a 6,500 sq ft retail space in Austin, TX. Include scope (project management, third-party coordination, menu engineering), an 8-month timeline, billable milestones, and fees by phase.» | Food Hall Consulting Proposal | Business Proposal |
| «Design a KPI dashboard for the first quarter post-opening: cover operational metrics (occupancy, average check, covers/day), financial (actual vs. theoretical food cost, labor cost, prime cost), and reputation (Google rating, monthly reviews). Include targets and reporting frequency.» | Opening KPI Dashboard | Operational Dashboard |
| «Develop a staffing and training plan for the kitchen and front-of-house of a 95-seat market-driven restaurant. Include executive chef and sous chef profiles, general manager profile, headcount by area, hiring timeline (weeks -12 to -2), and an initial training plan.» | Restaurant Team Staffing Plan | People Management |
| «Calculate the break-even point for a 2,200 sq ft space in a commercial district of Denver, CO, with a rent of $9,000/month, initial investment of $410,000 fully amortized over 10 years, and monthly fixed costs of $15,500. How many covers per month are needed to cover costs and start generating profit?» | Break-Even Point & Covers | Financial Analysis |
| «Perform a simplified due diligence on an existing restaurant acquisition in Miami, FL: working capital needed, valuation of goodwill, analysis of contracts (lease, suppliers, employees), review of the last 2 years' financials, and a buy/don't buy recommendation with justification.» | Restaurant Acquisition Due Diligence | Investment Analysis |
| «Generate a detailed opening roadmap for a Nikkei Japanese restaurant with sushi bar in Portland, OR. Include: Phase 1 (months -5 to -3) permits & build-out; Phase 2 (months -3 to -1) supplier selection and equipment; Phase 3 (month -1) training and testing; Phase 4 (day 0) soft opening. Budget by phase.» | Nikkei Opening Roadmap Portland | Project Planning |
| «Export to CSV a plate costing template for a 25-item menu with: dish name, main ingredients with quantity and unit cost, yield percentage applied, raw material cost per plate, selling price, food cost%, contribution margin. Include 5 dishes from each category: appetizers, fish, meats, desserts.» | Plate Costing Template CSV | Data Export |
| «Propose a full menu engineering analysis for a 1,300 sq ft gastrobar with 32 small plates and a cocktail list. Use the popularity-profitability matrix to classify dishes into Stars, Plowhorses, Puzzles, and Dogs. Recommend which items to drop, reprice, or keep, justifying with contribution margin data.» | Menu Engineering Matrix | Offer Optimization |
| «Develop a contingency plan for a restaurant opening in New York City covering: delay in obtaining health department permit (maximum legal timeframe, alternatives), hired chef quits before opening (emergency replacement profile, candidate pool), fish supplier fails to deliver on day one (backup alternative supplier), and recommended contingency budget (percentage of total investment).» | Opening Contingency Plan | Risk Management |
Prompts for Financial Management & Profitability Consultant in Gastronomy Consultant Pro
The Financial Management & Profitability Consultant diagnoses the financial health of restaurants, bars, cafes, and hospitality operations, uncovering leaks in food cost, beverage cost, and labor cost. It turns raw purchase and sales data into decisions: plate costing with real yields and waste, menu-engineering by profit contribution, strategic pricing, and KPI dashboards that let owners and investors act with precision. The goal is to push net margin into the 15–20% sweet spot where profitable restaurants operate, and the consultant shows exactly which dollars to save first.
How to use these prompts
These are starting points you can tailor to your kitchen and your recipe collection. For instance, if you start with the prompt “Calculate the plate cost for a dish,” you could customize it like this: “Calculate a full plate-cost card using current market purchase prices (search Google for whole Mediterranean branzino, Angus ribeye, Gulf white shrimp, baby spinach, asparagus, and shiitake mushrooms in Chicago as of April 2025), apply the corresponding waste percentages (whole fish 45%, ribeye 30%, shrimp 50%, premium vegetables 20%), and add costs for oil ($0.22), water ($0.05), gas ($0.14), and laundry ($0.12 per cover)…” The more specific you are, the better the result.
| Prompt / Request | Area / Goal / Pain point | Category |
|---|---|---|
| «Audit last year’s P&L (revenue $1,250,000, food cost 32%, beverage cost 22%, labor cost 34%, rent $48,000, utilities $18,000, insurance $9,600, maintenance $14,400, marketing $24,000, financial expenses $12,000), calculate EBITDA, actual net margin, break-even annual revenue, operating cash flow, and identify the top 5 dollar leaks with quantified impact» | Financial analysis & P&L | Comprehensive diagnostic |
| «Calculate real vs theoretical food cost for the current menu (150 dishes, average turnover 2.8 times/dish/week, average check $28.50 net of tax, average monthly raw material purchases $31,200), detect deviations by category (appetizers, mains, desserts) and propose corrective actions with estimated margin impact» | Real vs theoretical food cost | Cost optimization |
| «Generate a financial diagnostic report in PDF with P&L by department (kitchen, bar, dining room), analysis of the 3 key ratios (food, beverage, labor), current prime cost vs target (<65%), profitability heatmap by dish, and prioritized recommendations with implementation timeline» | Diagnostic report | Consulting deliverable |
| «Search Google for food cost, beverage cost, and labor cost benchmarks for full-service restaurants in the United States in 2025, segment by location (Manhattan, downtown Austin, suburban St. Louis), cuisine type (New American, Italian, upscale casual), and average ticket range ($25–45, $45–75, $75+), then compare with the restaurant’s actual numbers» | 2025 market benchmarks | Comparative analysis |
| «Export to CSV the complete list of plate-cost cards (85 dishes) with columns: dish code, name, family, raw material cost, production cost, total cost, selling price before tax, menu price with tax, food cost %, margin $, margin %, weekly turnover, weekly profitability, and classification (star/plowhorse/puzzle/dog) according to the popularity-profitability matrix» | Plate-cost card export | CSV file |
| «Run full menu engineering: classify the 120 menu items into the popularity-profitability matrix (X-axis: weekly sales, Y-axis: unit gross margin), identify stars (high sales, high margin), plowhorses (high sales, low margin), puzzles (low sales, high margin), and dogs (low sales, low margin), and propose an action plan for each category with estimated impact on revenue and margin» | Menu engineering | Profitability matrix |
| «Design strategic pricing for the new seasonal menu (45 new dishes): analyze price sensitivity of the target customer (urban 30–45 age group, average ticket target $42), apply psychological pricing rules (endings .99, .95, .49), calculate optimal price by category (appetizers $12–18, mains $22–32, desserts $7–12), and determine the effect on average ticket and estimated demand using price elasticity» | Strategic pricing | Revenue optimization |
| «Create a financial KPI dashboard in PDF with the 12 essential indicators for investor reporting: daily/weekly/monthly revenue, average check, cover count, food cost %, beverage cost %, labor cost %, prime cost %, gross margin, EBITDA, net margin, break-even point reached, and variance vs budget, with trend graphs and traffic-light alerts» | KPI dashboard | Investor reporting |
| «Identify quick wins with immediate impact (0–30 days) vs medium-term structural improvements (60–90 days) to improve prime cost from current 72% to target 63%: list fast actions (supplier renegotiation, elimination of 12 low-performing dishes, portion optimization, 15% waste reduction) and strategic actions (menu redesign, investment in blast chillers, team cost-control training) with estimated investment and expected return» | Quick wins vs structural improvements | Roadmap |
| «Calculate plate costs with actual waste for the 10 most critical items on your menu (whole branzino, beef tenderloin, Iberico pork collar, Gulf white shrimp, Maine lobster, Arborio rice, extra-virgin olive oil, California Cabernet, specialty coffee, and house-made chocolate lava cake), applying exact waste percentages (fish 40–50%, beef 25–35%, shellfish 50–60%, rice 5%, oil 2%, wine 8%, coffee 10%, dessert 12%), and determine the real cost per portion for each» | Plate costing with waste | Detailed calculation |
| «Perform financial due diligence on a restaurant for sale: revenue last 3 years ($890,000; $950,000; $1,020,000), labor cost ($285,000; $308,000; $340,000), cost of goods sold ($268,000; $285,000; $306,000), rent ($52,000/yr), CAM ($4,800/yr), utilities ($14,400/yr), calculate adjusted real EBITDA, implied valuation multiple (EBITDA method), payback on the asking price of $1,450,000, and issue a buy/no-buy recommendation with fair price» | Due diligence | Acquisition valuation |
| «Project a 3-year business plan for opening a 60-seat, 1,300 sq ft restaurant in an urban Chicago neighborhood: break down initial investment (build-out $180,000, equipment $95,000, furniture $35,000, permits/licenses $22,000, working capital $48,000, pre-opening marketing $15,000), project revenue Year 1 $720,000, Year 2 $850,000, Year 3 $980,000, calculate EBITDA and net margin per year, estimated payback, IRR, break-even point, and identify top 5 risks with mitigation» | Business plan | Financial viability |
| «Calculate the impact of menu optimization on food cost: if you eliminate the 18 lowest-selling dishes (avg 0.5 sales/week, avg food cost 38%) and increase turnover of the top 10 stars (from 8 to 10 sales/week), estimate the improvement in overall food cost, the annual gross margin increase, and the payback time for the investment in team training and internal marketing to push the stars» | Menu optimization | Profitability impact |
| «Draft a consulting proposal for a hospitality group with 3 restaurants (aggregate revenue $2,800,000, average food cost 34%, labor cost 32%, net margin 8%): define scope (comprehensive audit, menu engineering, operations optimization, management training), timeline (8-week diagnostic phase, 12-week implementation), deliverables, assigned team, fees (monthly fixed fee or success fee tied to EBITDA improvement), payment terms, and a reference case with similar improvement achieved at another client» | Consulting proposal | Commercial and fees |
Prompts for Operations Advisor (Kitchen, Dining Room & Bar) in Gastronomy Consultant Pro
As an operations advisor, you need to sharpen production and service flows, control waste and beverage cost, build solid SOPs and make the bar a profit center. The Gastronomy Consultant Pro agent runs financial audits, calculates plate costs with real yields, benchmarks your market and generates professional deliverables—dashboards, diagnostic reports, action roadmaps—ready to present to owners or investors. Whether you’re tightening a P&L, engineering a menu or planning an opening, you get actionable, data‑driven recommendations framed for a US kitchen that works under the FDA Food Code, HACCP and FALCPA allergen rules.
How to use these prompts
Model your own operation with real numbers. If the prompt starts «Calculate the plate cost of roasted branzino with sides, considering whole fish has 45% waste and the purchase price is $14.50 per pound,» you can make it your own: «Calculate the full plate cost (ingredients, energy, actual yield) for roasted branzino with rosemary potatoes and roasted vegetables. Whole fish: 45% waste (head, bones, viscera), purchase price $14.50/lb; potatoes $0.80/lb (20% waste); zucchini $1.50/lb (15% waste). Include energy cost (convection oven 12 kW for 25 min, induction burner 6 kW for 20 min) and labor (line cook $18.00/hr, prep cook $14.00/hr).» The more specific you are, the better the result.
| Prompt / Request | Area / Goal / Pain point | Category |
|---|---|---|
| «Run a complete P&L analysis for my restaurant with monthly revenue of $85,000, average check $38.50, 73 daily covers (2,190 monthly), current food cost 34%, beverage cost 22%, and labor cost 32%. Calculate prime cost, break‑even point and detect the main profit leaks, comparing with industry target ratios (food cost 28–35%, beverage 18–25%, labor 28–35%, prime cost <65%, net margin 15–20%).» | P&L Audit & Ratios | Financial Analysis |
| «Calculate the plate cost with actual waste for 8 signature dishes: branzino (45% waste, $14.50/lb), beef tenderloin (28% waste, $24/lb), creamy mushroom rice (rice 5%, mushrooms 35%), tuna tartare (fresh tuna 30%), fresh pasta (flour 3%), and desserts (fruit 20%, chocolate 5%). Include energy cost per dish (oven 12kW/25min, griddle 8kW/15min, induction burner 6kW/20min) and labor (chef $12.50/hr, assistant $9.80/hr). Generate a table with total cost, current selling price, food cost % and contribution margin for each dish.» | Plate Costing with Waste | Financial Analysis |
| «Benchmark the operational indicators of mid‑to‑upscale urban restaurants in 2024 for Chicago and New York: average check, average covers, food cost, beverage cost, labor cost, prime cost, net margin, occupancy rate, table turn time, and revenue per employee. Provide updated sources and numeric data.» | Market Benchmark 2024 | Market Data |
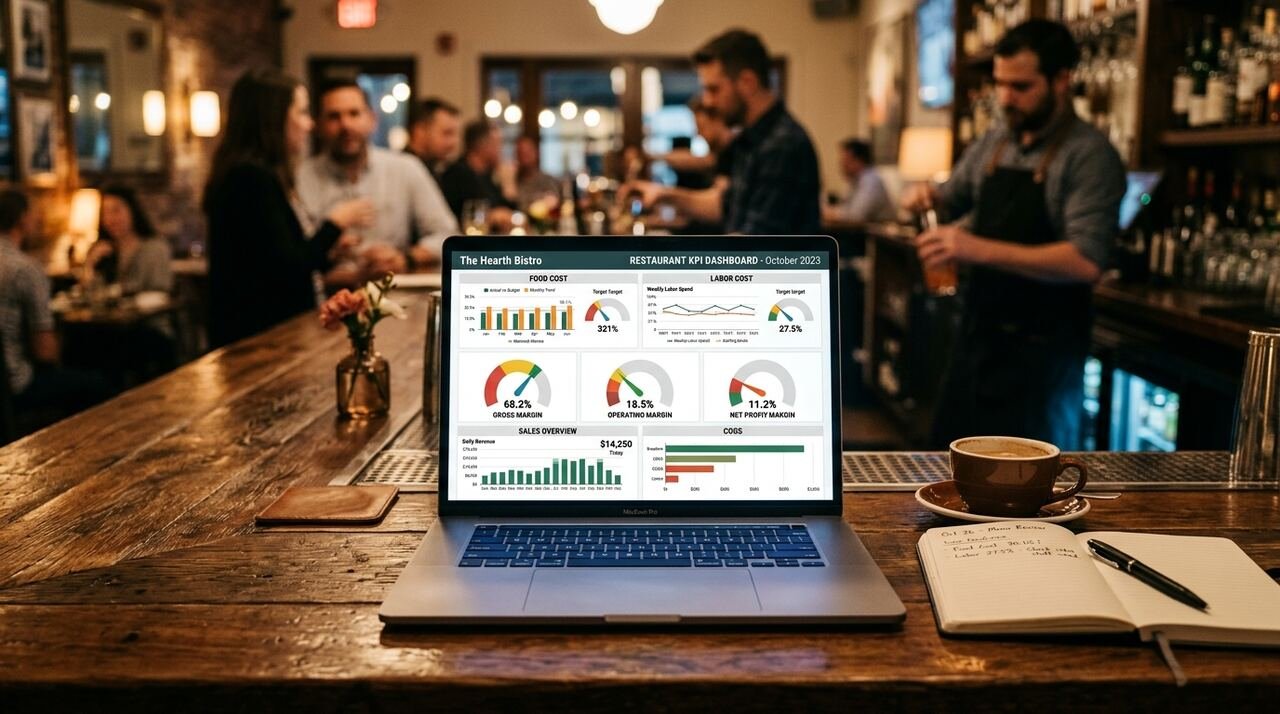
| «Generate an operational KPI dashboard for my restaurant with real data: monthly revenue $85,000, covers 2,982, average check $28.50, food cost 34% ($28,900), beverage cost 22% ($18,700), labor cost 32% ($27,200), prime cost 88%, gross margin $54,200, fixed expenses $38,000, EBITDA $16,200, profitability 19.1%. Include a 6‑month trend chart, a traffic‑light alert (red/yellow/green) for each ratio vs. target, and recommended corrective actions for every out‑of‑range KPI.» | KPI Dashboard | Consulting Deliverable |
| «Export a PDF operational diagnostic report that includes: executive summary, P&L analysis with variances, plate costings of the top‑10 dishes with waste detail, a prioritized action plan distinguishing quick wins (0–30 days) and structural improvements (60–90 days), and an estimated investment budget for the proposed improvements.» | Export PDF Report | Export File |
| «Develop an action plan differentiating quick wins (implementable in 30 days without significant investment) vs. structural improvements (60–90 days requiring investment and process change) to improve our current prime cost from 88% to the 65% target. For each action include: description, accountable person, estimated investment, expected annual savings, and monitoring KPI.» | Quick Wins vs. Structural | Improvement Plan |
| «Design the optimized production flow for an 80‑cover urban restaurant kitchen offering a menu of 12 appetizers, 8 mains and 6 desserts, serving lunch (12:00–4:00 PM) and dinner (8:00 PM–12:00 AM). Define: workstations (mise en place, grill, sauté, pastry, expo), prep times per dish, firing sequence, quality checkpoints, staffing per shift (chef de partie, assistants, runner), and a kitchen‑dining room communication system (KDS, printed tickets). Estimate max capacity per service and target average ticket time.» | Kitchen Production Flow | Operations Optimization |
| «Calculate and optimize my bar’s beverage cost considering: cocktail menu (18 references, avg. 120 units/week), wines by the glass (12 references, 80 glasses/week), beers (6 references, 200 units/week), and digestifs/liqueurs (15 references, 40 units/week). Provide cost per unit, current selling price, margin per family, identify the 5 worst‑margin products, and propose elimination, reformulation, price adjustment or supplier change. Calculate the target beverage cost per family and the potential annual savings.» | Beverage Cost Optimization | Bar Management |
| «Design comprehensive SOPs for dining‑room service in a mid‑scale restaurant: guest greeting and menu presentation, service sequence (aperitif, starter, main, dessert, coffee), target times between courses (minutes), complaint‑handling protocol, reservation management (confirmation, no‑show, wait list), kitchen communication (ticket, modifications, allergies—covering FALCPA’s 9 major allergens), check closing and farewell. Include opening/closing checklists and a per‑shift service evaluation form.» | SOPs Service | Standardization |
| «Analyze the profitability of my 45‑dish menu using the popularity‑profitability matrix: stars (high sales, high margin), horses (high sales, low margin), puzzles (low sales, high margin), dogs (low sales, low margin). With actual monthly unit sales and current margins, list dishes to eliminate (dogs), reformulate (horses), promote (puzzles), and maintain with possible price increases (stars). Calculate the revenue and margin impact if the recommendation is implemented 100%.» | Menu Engineering | Revenue Engineering |
| «Develop a training plan for the front‑of‑house team (4 servers, 2 bussers) and bar (2 bartenders) covering: product knowledge (wine list, signature cocktails, menu items), cross‑selling techniques (pairings, recommendations), objection handling, complaint management, POS system new features, and upselling (target $4.50 increase in average check per cover). Set a training calendar (4 two‑hour sessions over one month), methodology, evaluation, and post‑training KPI tracking.» | Team Training Plan | People Management |
| «Conduct a feasibility study for implementing an online reservation system (OpenTable, Resy, or an own platform) in my 80‑cover restaurant, factoring: implementation cost (setup + per‑cover commission), estimated occupancy lift (target 15% increase in covers), no‑show reduction (from 8% to 3% target), opportunity cost of empty tables, and 12‑month ROI. Compare at least three options and recommend the best fit for an urban restaurant with an average ticket of $35 and a largely local and business clientele.» | Online Reservation Feasibility | Digitalization |
| «Calculate the economic impact of reducing operational kitchen waste from the current 12% to a 5% target. Starting from a monthly raw‑material purchase of $28,000, identify waste sources (trimming, storage, spoilage, production errors), propose a control system (weighing mise en place, yield cards, daily inventory, training), and calculate: monthly savings, annual savings, food‑cost reduction in percentage points, and payback period for the $1,200 investment in training and scales/thermometers.» | Kitchen Waste Control | Cost Optimization |
| «Design the optimal cocktail menu for my bar (8 spirit stations, 12 cocktails, 6 wines by the glass, 4 beers) maximizing contribution margin while considering ingredient cost, selling price, expected turnover, synergy with the food menu (pairings), seasonality, and market trends. Provide a final list of 12 signature cocktails with full costing, recommended selling price to hit 20% beverage cost, and margin per unit. Suggest two seasonal cocktails to rotate quarterly.» | Profitable Cocktail Menu | Bar Management |
| «Generate an opening roadmap for a 120‑cover modern Mediterranean restaurant, total investment $280,000, in a city of more than 500,000 population. Phase 1 (0–30 days): concept definition, team, permits/licenses. Phase 2 (31–90 days): build‑out, kitchen/dining‑room equipment, suppliers. Phase 3 (91–120 days): hiring and training, menu, trials. Phase 4 (121–150 days): soft opening (50% occupancy), adjustments. Phase 5 (151–180 days): official opening and marketing plan. For each phase, list key tasks, partial budget, accountable person, deliverable, and KPI.» | 180‑Day Opening Roadmap | Business Plan |
Prompts for Restaurant Strategy, Growth & Expansion Consultant in Gastronomy Consultant Pro
As a Strategy, Growth & Expansion Consultant, you use the agent to diagnose stagnation or decline, design viability plans for new openings, model expansions—second units, franchising—and build customer acquisition and reputation strategies. The agent delivers rigorous financial analysis, current U.S. market benchmarks, and consulting-ready documents that hold up in front of owners, investors, and lenders. It turns raw P&Ls into actionable turnaround roadmaps, models unit economics for multi-site growth, and stress-tests concepts before capital goes to work.
How to use these prompts
Starting points you can adapt to your operation. For example, instead of “Give me tips to improve my restaurant,” you could say: “Full diagnostic and turnaround plan for a Mediterranean restaurant in Chicago doing $1.2M annual revenue, $38 average check, 55% occupancy, prime cost 68% (food 34%, labor 34%), net margin 4%. Identify financial leaks, prioritize 30‑day quick wins vs 60–90‑day structural improvements, and propose a brand repositioning with a new concept. Generate a diagnostic report.” The more specific you are, the better the result.
| Prompt / Request | Area / Goal / Pain point | Category |
|---|---|---|
| «P&L audit and financial leak detection for an urban-casual restaurant, $850K annual revenue, $32 average check, 78 covers/day, prime cost 71% (food 36%, labor 35%). Give me an overhead breakdown, true break‑even point, and a 90‑day cost‑reduction plan with area‑specific targets.» | Financial & P&L Analysis | Operational Diagnostic |
| «Plate‑cost analysis with yield for whole turbot (supplier $18.50/lb), Pacific cod loin ($14.20/lb), beef tenderloin ($22.80/lb), and market vegetables ($4.50/lb avg). Apply real‑world waste percentages, calculate effective yield, final plate cost for a 72% target gross margin, and output a comparative CSV table.» | Costing with Waste | Menu Engineering |
| «Export a full due‑diligence PDF for the acquisition of an operating restaurant in Miami, including last 3 years’ P&L, asset valuation, contract review (lease, suppliers, employees), adjusted EBITDA calculation, sector‑multiple valuation, and a buy/don’t‑buy recommendation with recommended maximum price.» | Due Diligence PDF | Investment Analysis |
| «Current U.S. restaurant benchmarks 2024‑2025: average food cost by concept (Mediterranean, Asian, steakhouse, seafood), average labor cost, target prime cost by segment, average check by city (New York, Los Angeles, Chicago, Houston), mean net margins by format, and first‑year closure rates. Use updated sources and provide percentile ranges.» | Current Market Benchmarks | Sector Analysis |
| «Build an operational KPI dashboard for a 3‑unit group: average occupancy, average check, weekly covers, actual vs. theoretical food cost, labor cost %, prime cost, gross margin per unit, cumulative EBITDA. Include trend charts, automatic alerts, and per‑restaurant targets versus budget and same period prior year.» | KPI Dashboard | Reporting & Control |
| «30‑day quick wins for a restaurant with $650K revenue, $28 average check, 48% occupancy: menu rationalization (drop 20% low‑margin dishes), renegotiate top 2 suppliers, demand‑based staff scheduling, upselling program during service, Google Business & Yelp promotion. vs. 60–90‑day structural improvements (rebrand, new menu, team training, waste‑control system).» | Quick Wins vs. Structural | Action Plan |
| «Viability plan for a second location of a successful restaurant in New York City. Unit one: $1.4M revenue, 16% net margin, $42 average check, 22% first‑year ROI. Second site in a prime neighborhood, estimated investment $420K (build‑out, equipment, working capital). Three‑year projections, payback, IRR, break‑even, optimistic/pessimistic scenario, and a go/no‑go recommendation with rationale.» | Second‑Location Viability | Business Plan |
| «Franchise model design for a 5‑unit Mexican fast‑casual chain, $4.2M aggregate revenue, 14% average net margin. Structure: $35K initial franchise fee, 5% royalty on sales, 2% marketing fee, exclusive territory, per‑franchisee investment $150K–$200K, unit economics, 3‑year expansion timeline, and template contractual documentation.» | Franchise Model | Expansion |
| «Customer acquisition and online reputation strategy for a fine‑dining restaurant in San Francisco, 95 covers, $85 average check, current Google rating 4.2 (180 reviews). Goals: reach 4.6+ in 6 months, lift direct reservations by 30%, reduce dependence on third‑party platforms (OpenTable, Yelp). Action plan: review management, social content, local SEO, food‑influencer partnerships, loyalty program. Provide implementation calendar and measurable KPIs.» | Acquisition & Reputation | Digital Marketing |
| «Repositioning report for a traditional Spanish restaurant in Boston in crisis, revenue down 35% over 18 months (from $1.1M to $715K), core clientele 75+, stale image. SWOT analysis, viable new concept, full rebrand (name, logo, menu, decor, messaging), estimated investment $85K, 18‑month recovery projection, and launch marketing budget.» | Brand Repositioning | Turnaround |
| «Consulting proposal for a premium seafood restaurant project in Chicago’s business district, total investment $580K, 2,400 sq ft, 90 covers, menu built around 25 fresh seafood and fish references. The developer seeks a 360° strategic partner. Proposal must include scope of work, 6‑month timeline, fee structure (fixed fee + success fee on Year‑1 EBITDA), and guaranteed deliverables.» | Consulting Proposal | Commercial |
| «Menu engineering for a 120‑cover Italian restaurant, $1.1M revenue, $34 average check, 69% prime cost. Build popularity‑profitability matrix for current 32‑item menu, identifying stars, horses, puzzles, and dogs. Propose an optimized menu: eliminate 8 dishes, introduce 6 new with costed recipes, strategic pricing to raise average check to $38 while holding food cost under 32% and targeting 18% net margin.» | Menu Engineering | Optimization |
| «Growth plan for a hospitality group with 2 restaurants aiming for 5 units in 3 years. Analyze current model, define a replicable concept, prioritize target cities (New York, Chicago, Austin), design optimal corporate structure, financing strategy (equity vs. debt vs. outside investment), opening timeline, resource planning (central team, chefs, systems), and expansion KPIs.» | Group Growth Plan | Strategy |
| «Full due diligence for private equity investment in a 12‑unit sushi chain, consolidated revenue $8.5M, EBITDA $1.4M (16.5% margin). Unit‑by‑unit economics, location quality, lease expiration risk, supplier concentration, debt structure, management team, operational and regulatory risks, valuation at 6–8x EV/EBITDA, deal structure, and investment recommendation with a preliminary term sheet.» | Investment Due Diligence | Analysis |
| «360° opening roadmap for a Japanese restaurant in downtown Seattle, investment $340K, target open Q2 2025. Phases: site selection (1,100–1,600 sq ft), architectural plans and permits, team hiring (chef, sous chef, FOH), menu development and costing, sourcing Japanese ingredients and kitchen equipment, pre‑opening marketing (soft opening, waitlist, influencers), tech stack (POS, reservations, inventory), staff training, and launch playbook. Detailed timeline with milestones and responsible parties.» | Opening Roadmap | 360° Project |
Prompts for Business & Team Structure for the Independent Restaurant Consultant in Gastronomy Consultant Pro
This advisor helps you build the organizational backbone of your consulting practice and your clients’ operations. It creates organizational charts, role profiles, and training plans, reduces staff turnover, and structures the business side of your firm: commercial proposals, fee models (diagnostic, retainer, project-based), scope of work, and management of multiple concurrent engagements. Gastronomy Consultant Pro helps you professionalize your offering and manage clients with battle‑tested methodologies.
How to use these prompts
These are starting points you can adapt to your kitchen and your portfolio. For example, if you start with the prompt “Give me a commercial proposal template for a client opening a 2,150 sq ft restaurant in Austin, TX,” you could customize it like this: “Give me a commercial proposal template for a client opening a modern Mediterranean restaurant, 2,150 sq ft (200 m²), 80 seats, in downtown Austin, estimated investment $500,000, with fees structured as diagnostic phase ($6,000), strategy ($14,000), and implementation retainer ($4,000/month for 6 months). Include scope, deliverables, timeline, and payment milestones.” The more specific you are, the better the result.
| Prompt / Request | Area / Goal / Pain point | Category |
|---|---|---|
| «Analyze the P&L of a restaurant with annual revenue $1,200,000, food cost 32%, labor cost 34%, rent 8%, utilities 3%, other operating expenses 12%. Calculate EBITDA, net margin, and break‑even point» | P&L and profitability | Financial analysis |
| «Calculate the cost breakdown of a whole turbot, 5.5 lb (2.5 kg) purchased at $9/lb, with 45% trim loss in cleaning. Determine the raw ingredient cost per portion (7.8 oz clean weight, 220 g) and the selling price for a target food cost of 31%» | Yield costing with shrinkage | Cost calculation |
| «Export a PDF of the operational diagnostic report covering kitchen, dining room, bar performance ratios and a prioritized improvement plan» | Export report to PDF | Deliverable document |
| «Give me the 2024 industry benchmarks for food cost, beverage cost, labor cost, and prime cost in mid‑to‑upscale restaurants in the US. Provide ranges by concept type (casual dining, fine dining, tapas bar)» | 2024 sector benchmarks | Market data |
| «Generate a fee proposal for a 6‑month turnaround project at a 90‑seat restaurant in Portland, OR, with annual revenue $850,000 and a ‑3% operating margin. Include diagnostic, action plan, and monthly retainer» | Proposal with fees | Commercial document |
| «Build an action plan with quick wins executable in 30 days (reduce waste, renegotiate rent, optimize shifts) and structural improvements for 60‑90 days (menu redesign, team training, new purchasing system)» | Quick wins vs structural | Action plan |
| «Design the organizational chart and team structure for an 80‑seat restaurant with an open kitchen, bar area, and patio. Include positions, hierarchy, employee‑to‑cover ratio per service, and estimated monthly labor cost» | Opening org chart | Team management |
| «Define the professional profiles needed for a 50‑seat chef‑driven restaurant: executive chef, sous chef, line cook, prep cook, maître d’, senior server, bartender. Include responsibilities, annual gross salary, and competency profile» | Profiles and salaries | Team management |
| «Develop a pre‑opening training plan for a team of 15 (8 kitchen, 7 front‑of‑house) with a 4‑week timeline before opening: training areas, hours per person, methods, and evaluation» | Pre‑opening training plan | Talent development |
| «Propose a staff retention strategy for a restaurant with 45% annual turnover: incentives, career path, workplace culture, and tracking metrics» | Reduce turnover | People management |
| «Structure the business model of an independent restaurant consulting firm: hourly rates (on‑site diagnostic, written report, full project), monthly retainers for repeat clients, and service packages for 360° openings» | Consulting business model | Strategy |
| «Calculate the viability of a tapas restaurant franchise project with an initial investment of $200,000 per unit, 5% royalty on sales, $30,000 entry fee, and average annual sales per location of $550,000. Project payback over 3 years and IRR with pessimistic/optimistic scenarios» | Franchise viability | Investment analysis |
| «Generate an operational KPI dashboard for a restaurant group with 3 locations: average check, cover rotation, actual vs theoretical food cost, labor cost per hour, satisfaction score (Google Reviews), food waste (lbs), and inventory turnover» | KPI dashboard | Operational reporting |
| «Perform a supplier audit for a restaurant with 15 critical SKUs (olive oil, wine, primary protein, seafood, meat, produce). Compare bids, indicate potential savings, and evaluate payment terms» | Supplier audit | Cost optimization |
| «Design the guest experience for a Nikkei fusion concept restaurant: ambiance, service protocol, cocktail pairing menu, service timing, and differentiators that justify an average check of $70» | Experience and positioning | Concept design |
Tips for getting more out of Gastronomy Consultant Pro
Define Concept & Location
Always include restaurant type and city/neighborhood so Gastronomy Consultant Pro tailors benchmarks to your market. For example: "Calculate target food cost for a specialty coffee shop in Williamsburg, Brooklyn with a $6.50 average ticket." This localizes cost data, rent norms, and competitive set.
Use Hard Numbers
Vague terms yield vague answers. Feed Gastronomy Consultant Pro concrete covers, sales, and cost percentages. For instance: "A 150-seat restaurant in Chicago grosses $95,000/month with 32% labor cost. What’s the max food cost to hold prime cost at 63%?" That triggers a precise, actionable calculation.
Request Industry Benchmarks
Ask Gastronomy Consultant Pro to compare your numbers against sector averages. Example: "Compare the average prime cost for upscale Mexican restaurants in Los Angeles with our 68%, and tell me if we’re in range." This contextualizes your performance, not just a raw figure.
Specify Output Format
Tell Gastronomy Consultant Pro exactly how you want the answer—table, bullet list, memo, or calculation. Example: "Show the plate cost breakdown for our dry-aged ribeye as a table: ingredient, quantity, unit cost, total cost, and margin %." You’ll get a kitchen-ready document, not a paragraph to decipher.
Merge Strategy & Operations
Combine financial targets with menu mix decisions. Example: "Our food cost is 36%. The top seller is a double smash burger at 30% of sales. What menu engineering moves can drop food cost to 31% without killing covers?" Gastronomy Consultant Pro will suggest cross-utilization, portioning, or pricing tweaks.
Model Multiple Scenarios
Don’t settle for a single projection. Request conservative, moderate, and optimistic cases. Example: "Project 12-month ROI for a fast-casual poke concept in Austin with $200K startup cost, modeling monthly revenue at $30K, $45K, and $60K." That builds a range, not a fragile single-point forecast.
Factor In Seasonality
For tourist-driven or patio-heavy spots, prompt Gastronomy Consultant Pro to account for peaks and troughs. Example: "Build a quarterly cash flow for a rooftop bar in Miami expecting $50K in Jan, $80K in Feb, $120K in Mar, with a 28% food cost." This prevents off-season surprises.
Demand Actionable Steps
Move beyond analysis—ask for an implementation plan with owners, timeline, and metrics. Example: "For reducing labor cost from 37% to 30% in our full-service restaurant, list the three highest-impact actions, estimated monthly savings, and a 90-day rollout schedule." You’ll get a manager’s playbook.
Exploit Multi-Unit Data
If you run a group, ask Gastronomy Consultant Pro to compare units. Example: "Compare our three pizzerias in Boston, Cambridge, and Somerville on average check, covers, and table turn. Then recommend an ops standardization plan to lift the lowest performer." Cross-location insights drive consistency.
Save & Reuse Winning Prompts
When a prompt nails it, save it as a template. Example: "Create a reusable prompt for a monthly P&L deep-dive that always pulls: sales, food cost, labor cost, occupancy, other opex, prime cost, and budget variance." This builds a library of proven queries for your team.
More prompt libraries for AI Chef Pro agents
Every agent in the suite has its own prompt library. Browse the rest and put the AI to work across your whole operation:
- Prompts for Allergen ID
- Prompts for Avant-garde Cuisine
- Prompts for Bakery Consultant Pro
- Prompts for Barista Consultant Pro
- Prompts for Bartender Consultant Pro
- Prompts for Burgers Pro AI+
- Prompts for Catering AI+
- Prompts for Chef Consultant Pro
- Prompts for Chocolate Consultant Pro
- Prompts for Creative Bakery
- Prompts for Creative Chocolate Making
- Prompts for Creative Ice Cream Making
- Prompts for Creative Pastry
- Prompts for Gastro Lexicum
- Prompts for Executive Chef Pro
- Prompts for Fermentus Pro AI+
- Prompts for Food Pairing AI
- Prompts for Waste GenCal
- Prompts for Gelato & Ice Cream Consultant
- Prompts for Pastry Consultant Pro
- Prompts for Pizza Consultant Pro
- Prompts for VegChef Plant-Based
- Prompts for Restaurant Manager Pro
- Prompts for Sommelier Consultant Pro
- Prompts for Staff Meal
Frequently asked questions
What is Gastronomy Consultant Pro?
Gastronomy Consultant Pro is an AI agent inside AI Chef Pro built for HORECA business consulting. It performs financial diagnostics, P&L audits, food-cost, labor-cost and prime-cost calculations, recipe costing, business plans, due diligence and opening or expansion strategies.
Do I need restaurant experience to use it?
It works best when the user knows the trade and can interpret the numbers in context. That said, the agent is designed to guide first-time entrepreneurs through the fundamentals, so no prior restaurant experience is strictly required.
Are the benchmarks it uses current?
The agent draws on training data that includes HORECA industry benchmarks, but it always recommends cross-checking specific figures against local, up-to-date market data before making major investment decisions.
Can it replace a human consultant?
It is a productivity tool that multiplies what a consultant can do in a day. For complex due diligence, M&A work, or decisions carrying serious financial risk, a qualified human professional should still review the final analysis.
How do I get reports as a PDF or CSV?
Inside the AI Chef Pro platform you can export any analysis to PDF or CSV, ready to drop straight into your own professional reports or client presentations.
Does it work for any size of operation?
Absolutely — from a single food truck to a multi-unit chain. The agent scales the analysis to the volume of the business, but the underlying concepts and ratios apply across the whole sector.
Can it calculate my break-even point?
Yes. Ask for a break-even calculation and the agent will walk through fixed costs, variable costs and the sales estimate required to cover them, so you know exactly where the line is.
Does it include a competitive analysis?
If you supply data on similar spots in the area, the agent can run a competitive analysis comparing concepts, price points and positioning to give you a clear picture of the local landscape.
Can I use it to plan an expansion?
Absolutely. It is especially useful for building opening roadmaps, financial modeling of new units and viability studies when you are testing whether a concept can scale.
Is it safe to enter my clients' financial data?
AI Chef Pro meets industry confidentiality standards, but you should avoid entering personally identifiable client information into conversations and always handle financial data with professional discretion.